2.6 Changes
2.6.1 - Explain the concepts of limiting factors and carrying capacity in the context of population growth.
|
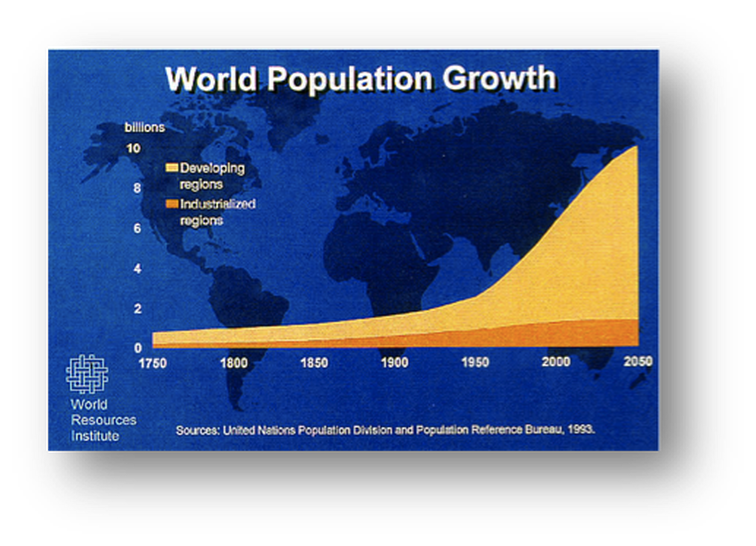
Population Dynamics: Population changes over time and as we know it has rapidly increased. There are many types of growths. If you have no limiting factors for example 2-4-8-16-32 than you should call it exponential or geometric growth. But this is very rare and world has never seen this type of growth as a whole. We often meet limiting factors which are very active in developing regions. Factors include:
- Density dependent limiting factors (biotic) which basically is a good thing because it is dependent and acts as a negative feedback. These factors can be divided as internal and external. For example a limited food supply will lead to competition between the species living in the same area – Internal. If area has lots of food (grass) for predators than it will automatically increase amount of their offspring which finally will lead to smaller prey type animal populations. (Many predators will eat them) – External. (Because victim species can do nothing about it. Both of examples are negative feedback and can regulate themselves in a specific amount of time - Density independent limiting factors (abiotic) which are not related to population density. Extreme climate or Natural hazards are independent liming factors and are not part of a feedback system. |
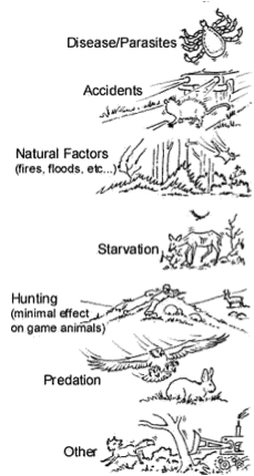
Population limiting factors
|
2.6.2 - Describe and explain S and J population curves.
Population dynamics usually have two types of shapes (curves on the graph); J type and S type.
|
S curves are associated with exponential growth but above certain size the growth rate slows down gradually, finally transforming into a population of constant size. Numbers stabilize at the carrying capacity of the environment which is the number or load of individuals that an environment can carry or support. S curve’s alternative name is environmental resistance.
|
J curves show a rapid increase and a boom pattern. At first population grows exponentially and then it suddenly collapses. Collapse is called dieback. Often in this type of curve population exceeds the carrying capacity before it collapses. This is called overshoot. Both of these curves below are idealized. In practice they won’t have ideal shapes.
|
Do you think that human population follow an S or J curve in the future?
2.6.3 - Describe the role of density-dependent and density-independent factors, and internal and external factors, in the regulation of populations.
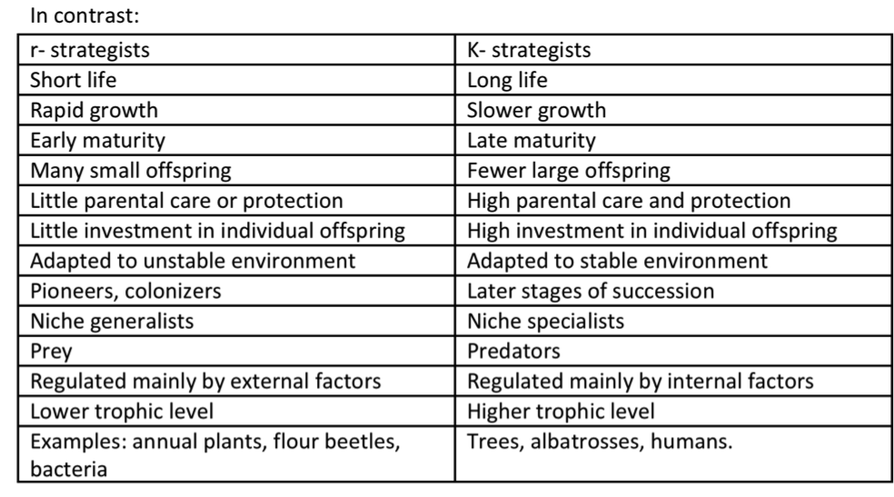
2.6.4 - Describe the principles associated with survivorship curves including, K- and r-strategists.
|
Survivorship curves: show the fate of a group of individuals of a species. This basically is a prediction. We mainly see three types of survivorship curves.
|
K and R strategists: Scientists divide species into K and R strategists. These strategies define their population growth and basic characteristics of an organism.
2.6.5 - Describe the concept and processes of succession in a named habitat.
|
Succession
Ecological Succession
Primary succession or prisere
|
2.6.6 - Explain the changes in energy flow, gross and net productivity, diversity and mineral cycling in different stages of succession.
2.6.7 - Describe factors affecting the nature of climax communities.